Historical Trends in Poverty and the Effect of Anti-Poverty Programs
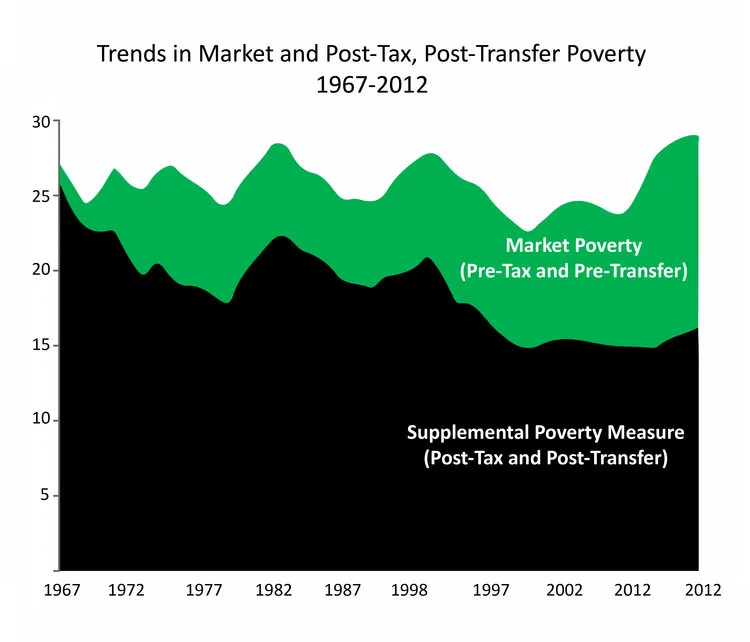
Our researchers have created a unique data set implementing the Census’ and Bureau of Labor Statistics’ Supplemental Poverty Measure back to 1967. This data set allows for more accurate measurement of poverty over time, and more critically the accurate assessment of the role of government policies and programs in reducing poverty.
Click here to download the historical SPM data and here to access state-level poverty estimates dating back to 1976.
HISTORICAL SPM DATA
CPSP researchers have created a historical version of the Census' and Bureau of Labor Statistics' Supplemental Poverty Measure (SPM), which dates back to 1967. The SPM improves upon official poverty statistics by taking a fuller accounting of the resources that families have at their disposal. As such, it is a useful tool for analyzing the effects of social policies on the lives of low-income families.
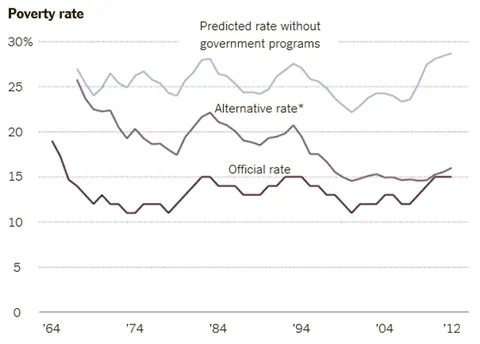
The CPSP has released a data table featuring the poverty rates from 1967 to 2017 measured under the Supplemental Poverty Measure (SPM). The data table includes the historical SPM poverty rates and the SPM poverty rates anchored to the 2012 SPM poverty thresholds, both with and without taxes and transfers. Results are calculated at the population level, as well as for children, working-age adults, and the elderly. This data table allows researchers to determine poverty rates in a given year without needing to download the historical SPM public-use data files.
The CPSP used the historical Supplemental Poverty Measure (SPM) data set to estimate the state-level trends in poverty from 1976 to the present. Click here to access data on the long-term poverty trends in your state.